As Facilities Intern, Neha Miryala Builds Dashboards to Raise Awareness About Campus Energy Consumption
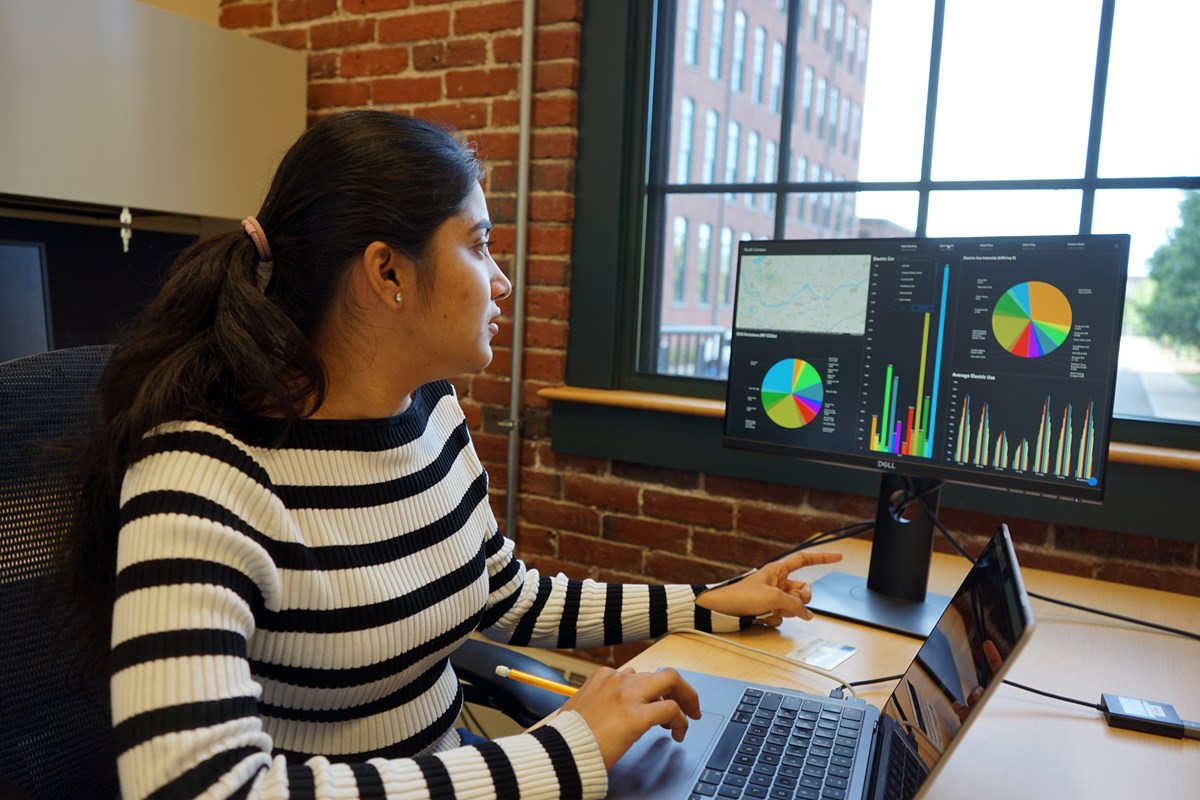 Image by Ed Brennen
10/18/2024
By Ed Brennen
Neha Miryala was looking for work that would enhance her data analytics and visualization skills while she pursues a master’s degree in computer science at UMass Lowell.
UML Energy Manager Daniel Abrahamson needed someone to build dynamic dashboards to display the real-time energy use, cost and emissions information on campus — and to develop a data warehouse that could be used to help the university improve operational efficiency.
An internship with Facilities Management proved to be a perfect match.
Miryala, a graduate student from Hyderabad, India, has spent the past year working with Abrahamson on new energy dashboards designed to raise student awareness of their carbon footprint and promote energy efficiency.
The dashboards will be featured on Hawki monitors in the university’s 10 residence halls, showing real-time electric and natural gas consumption for each building and offering energy-saving tips.
Miryala also created a scorecard system for residence halls that tracks the monthly electric cost per resident. The scorecards can be used for future energy-saving competitions, perhaps hosted by Residence Life or the Office of Sustainability.
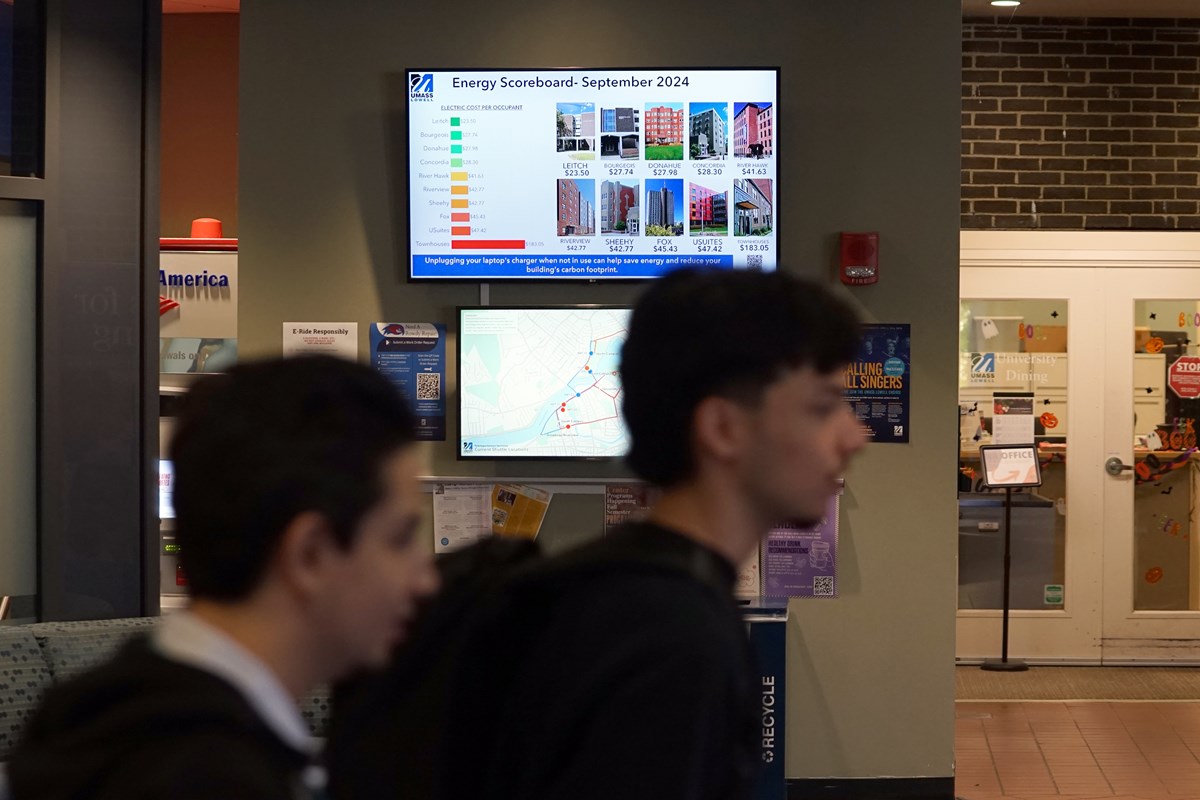 Image by Ed Brennen
The project began last fall with the Wannalancit Mills building on East Campus, where Miryala collected a year’s worth of energy data from Automated Logic, the university’s building management system. Because electric meters can sometimes malfunction, Miryala had to clean the data before creating a beta version of the dashboard with the data visualization tool Tableau.
When the project shifted to the 16 buildings on North Campus, she switched to ArcGIS Online, a geographic information system (GIS) platform that allows for more flexible and dynamic dashboards.
“If you want to see energy data for Ball Hall or Cumnock Hall, you can select that building on the dashboard,” Miryala explains. “The dashboard is dynamic, so anyone can explore energy trends for the past year, month or day.”
Meanwhile, Miryala used Microsoft SQL Server, a database management system, to build a data warehouse on the back end to store all of the university’s energy data. The SQL Server will automatically feed data to the dashboards and support future analytics that can lead to further improvements and efficiencies.
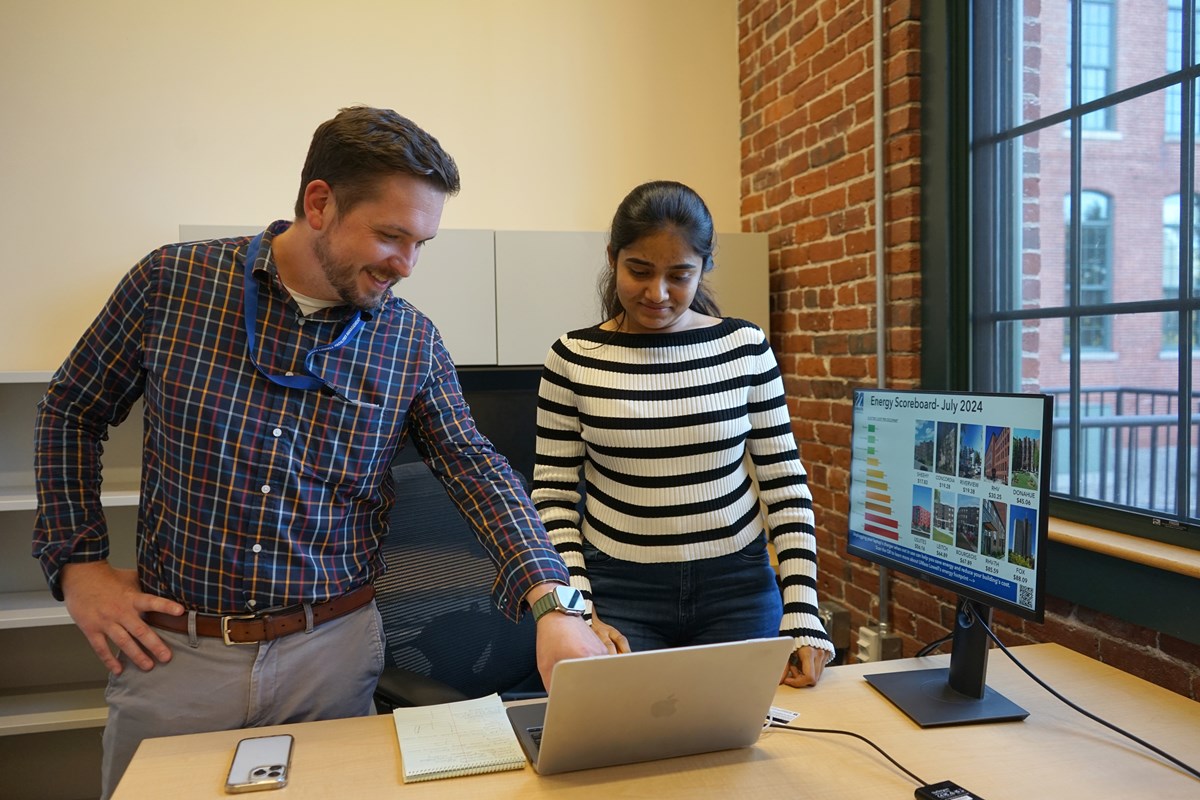 Image by Ed Brennen
“We wanted to make the data relatable to students to help them understand the impact of their energy use,” says Miryala, who notes that the project has reinforced her own environmental awareness.
The internship has also given Miryala invaluable experience in both front-end data visualization and back-end data engineering. Her work with ArcGIS and building the SQL Server data warehouse “from scratch” has helped her develop skills that she hopes to use in a future career as a full-stack developer or data engineer.
“I feel so honored to work on this project,” she says. “It’s been a great learning experience, and I’m excited to see how it helps the university achieve its sustainability goals.”
For Abrahamson and the Facilities Management team, having a talented student like Miryala has been a major asset.
“She’s done a phenomenal job,” Abrahamson says. “We’re excited to see how this dashboard will make a difference for the campus community.”